
At Segment.io we have a one-page app used to explore analytics data. Good memory management is a very important us, and the Heap Profiler in Chrome developer tools is the perfect tool for the job…. it’s just a bit hard to use.
My main use case for the Heap Profiler goes like this:
Find the object that I’m interested in… but how do you track down specific objects in this mess of memory references?
Check the object’s memory usage… this is where you have to go learn about shallow and retained size. Extremely helpful diagrams can be found here.
Try deleting all references to the object.
Make sure the object is really gone… but how do you know if something actually got deleted?!?! The total memory usage for the whole tab is an ok indicator for large objects… but memory usage jumps around and with smaller objects you’re out of luck without the profiler.
This post explains how we use the profiler to (1) Find the object of interest and (4) make sure the object got deleted. Some of the details are specific to apps using Backbone.js.
Four main views
The Heap Profiler has four main views Summary, Containment, Dominators and Comparison. The Summary, Containment and Dominators views are useful for tracking down specific objects, and the Dominators and Comparison views are useful for checking that things have actually been deleted. Here’s how we use each one:
Summary view
This view is good for tracking down specific objects based on their “type” (constructor name), because it shows objects in memory grouped by their constructor name.
For example, Dates are grouped under “Date” and Backbone.js objects are grouped under “child” because of naming in the backbone view constructor. In the minified version of Backbone 1.7.1 the constructor names change, so Backbone objects appear under “d” and the constructors appear under “q”.
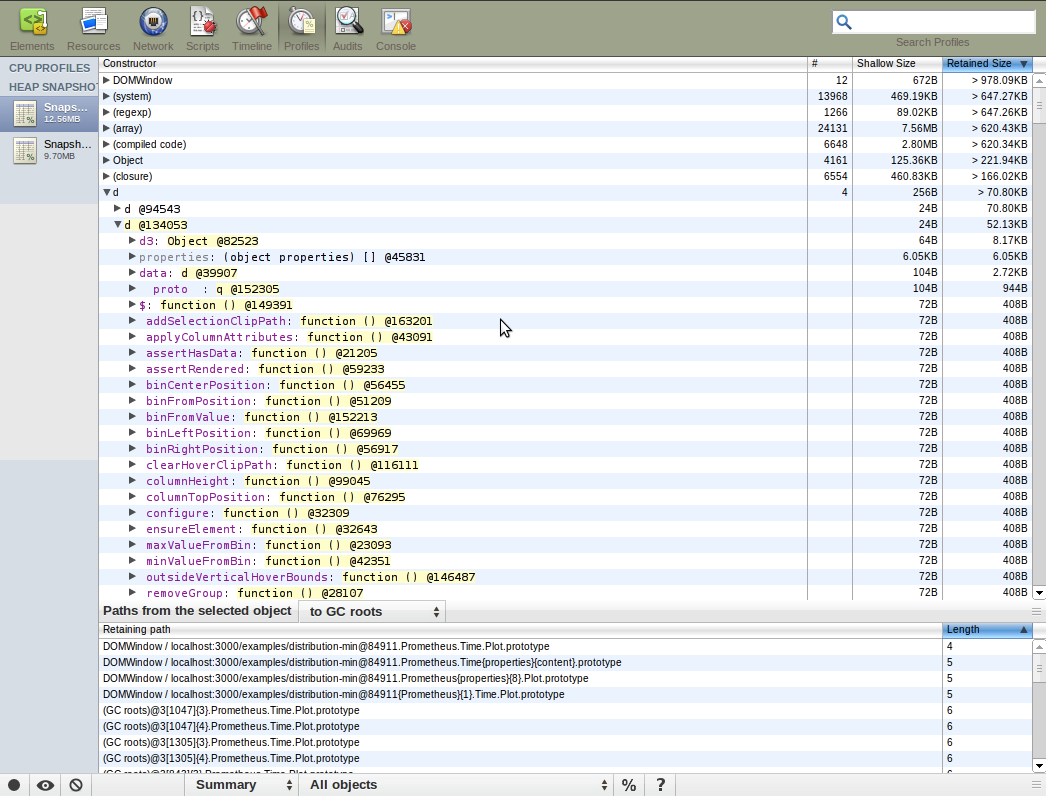
Here’s a screenshot of one of our distribution plot objects “d @94543” found in the summary view:
Containment view
This view is good for analyzing objects that are referenced in the global namespace… basically anything you put on the global window variable.
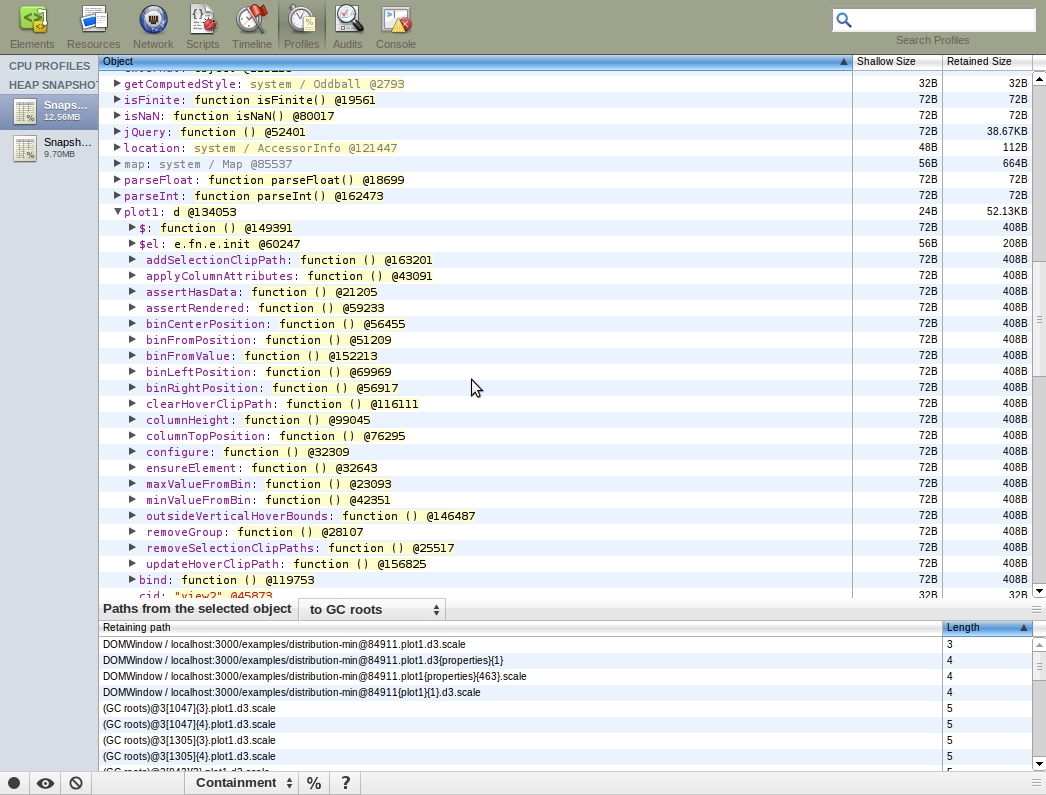
For example if you we window.seg and we want to see what it’s keeping around in memory, we open Containment -> the first DOMWindow -> seg. Here’s a screenshot of finding window.plot1 “d @94543” in the Containment view.
Dominators Tree view
This view is a good way to verify that your references are all properly contained (no unexpected references hanging around), and that deleting things is really working.
The view shows a tree of nodes in memory that “dominate” other nodes. From wikipedia: a node d dominates a node n if every path from the start node to n must go through d. This means that by deleting the dominator node d you remove all references to any dominated nodes n. So in effect, this tree shows you all the low-hanging fruit: if you delete d, you delete n. If you expected to see a particular object being dominated, but don’t, then you probably have a hanging reference to it somewhere!
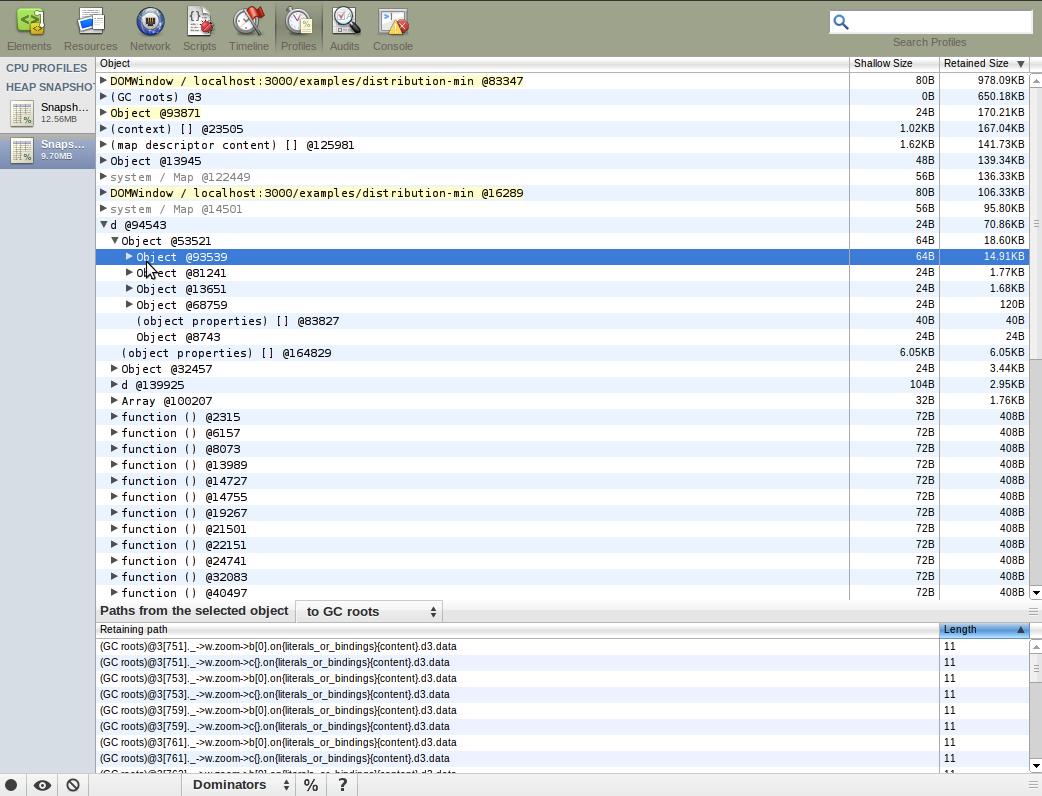
For our distribution charts I see a node “d @94543” that contains a bunch of other nodes. From clicking on each node I can figure out what they are. For example, the first node has a retaining path “(GC roots)@3[751]._->w.zoom->b[0].on{literals_or_bindings}{content}.d3” and that node’s children are “…d3.data”, “…d3.val”, “…d3.el” etc. So now I piece together that the first dominated node was the “this.d3” object inside a plot view, and the original dominator “d @94543” is a distribution plot object, and furthermore, if I delete “d @94543”, then all of the dominated nodes will be cleaned up as well, since because they are dominated there are no more references to them anywhere else. When I close and delete the reference to the distribution plot view, the node “d @94543” disappears from the dominators tree and memory usage drops by 3MB, so cleanup seems to work as expected.
Comparison view
This view is the best way to verify that deletion is working properly.
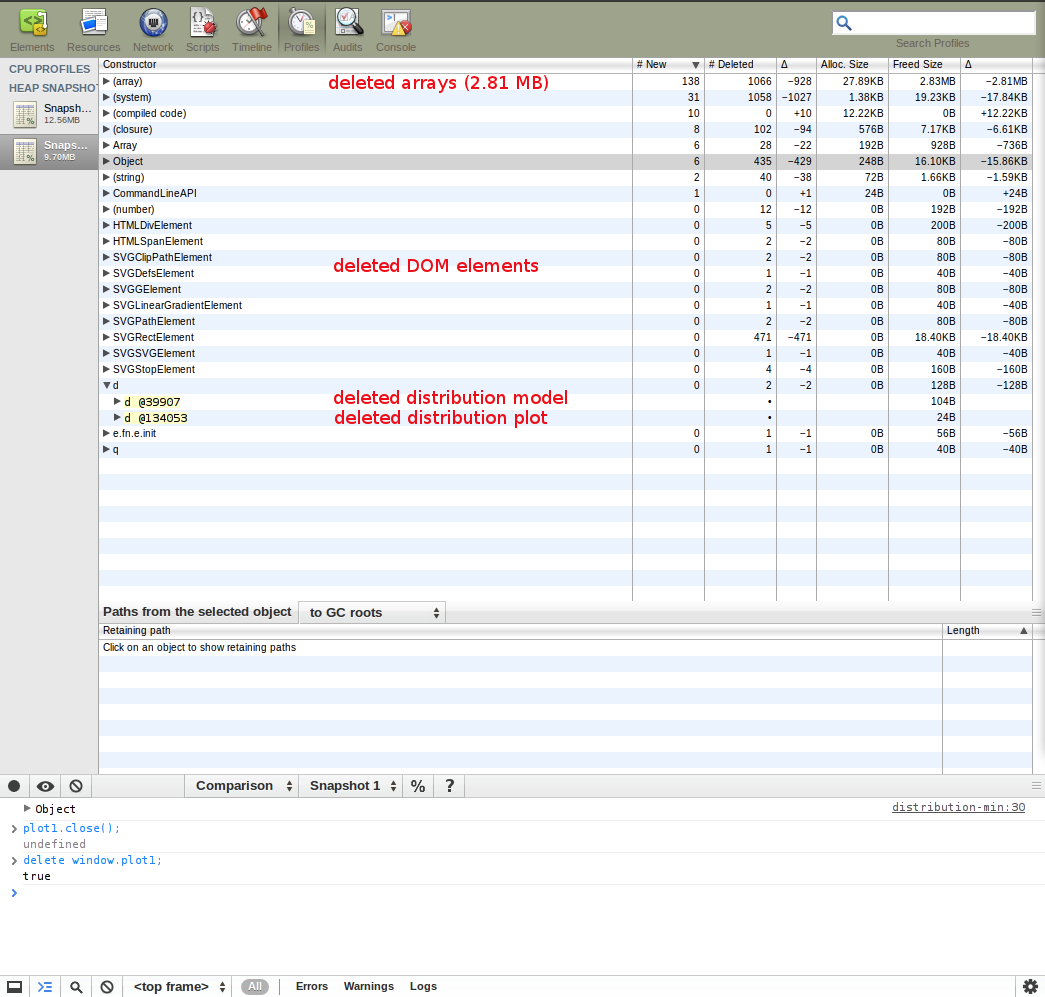
The view allows you to see the diff of two memory snapshots, showing you the delta in reference counts, freed memory, etc. The tricky/weird thing here is that in order to see what changed from Snapshot 1 to Snapshot 2, you want to first click “Snapshot 2” in the left hand column and then compare to “Snapshot 1”. When we delete objects in our code, I also see a whole bunch of deleted DOM elements, array objects, strings, closures, and numbers. Here’s a screenshot of the comparison view after a deletion:
Here are some links to other useful resources about the heap profiler: